Script Inspector
The Script Inspector is the right-side panel where you configure, execute, and monitor the selected automation.

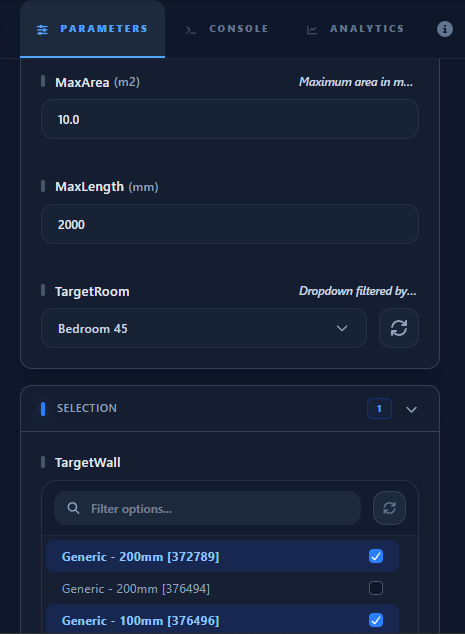
Parameters Tab
The Parameters tab is where you provide inputs to your script.
- Grouping: Click group headers (e.g., "Base Level") to expand related parameters.
- Compute (🔄): Click to fetch live data from Revit (like Level names) and convert text boxes into dropdowns.
- Execution: Click the play icon to execute. Successful runs will automatically populate the Analytics Tab with your results.
Analytics Tab
The Analytics Tab is a high-performance data visualization dashboard. It renders the structured data returned by your script via the Show() or Table() globals.
1. Data Tables
When your script calls Table(data) or Show("table", data), it is rendered as an interactive grid.
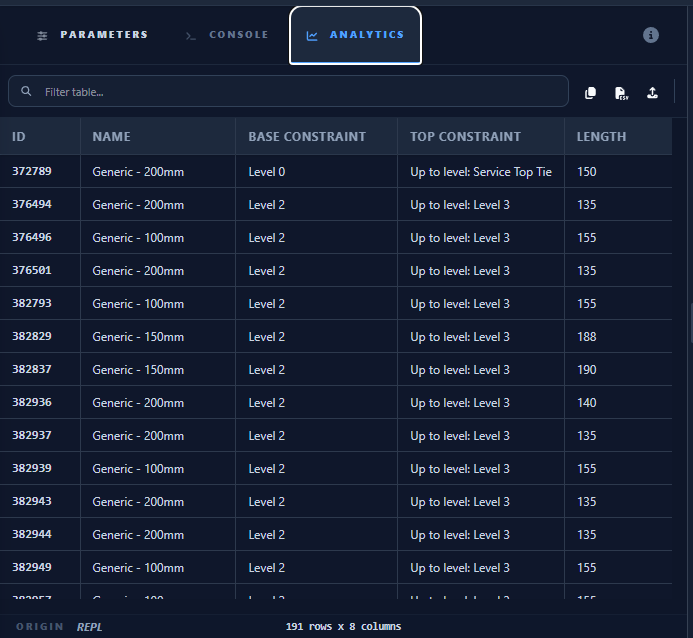
- Search & Sort: Use the search bar for instant filtering and click column headers to sort the data.
- Element Selection: Clicking a row immediately Selects the Element in your active Revit session (if the table contains an
IdorElementId).
2. Interactive Data Editing (NEW)
Paracore is a high-performance data visualization and monitoring hub. While Revit handles geometry, Paracore allows you to manage the underlying BIM data without opening complex property palettes.
- Single-Cell Edit: Double-click any data-centric cell (e.g., Room Names, Comments, Mark, or Finishes) to edit its value. Press Enter or click away to commit the change instantly to Revit.
- Mass Editing (CSV Round-Trip): For bulk updates, export the table to CSV, perform your edits in Excel, and upload the file back. Paracore uses the Id column to map and sync your changes back to the model in a single transaction.
- Modeling Boundary: Geometric parameters like Length, Width, and Area are reserved for Revit's modeling engine and are Read-Only within the Analytics Tab.
[!TIP] To modify geometry or perform complex model transformations, create a custom C# Script in the gallery. Scripts have full access to the Revit API and can manipulate any parameter or element property programmatically.
3. Table Controls
Located at the bottom of the tab, you can Copy the data to your clipboard or Export to CSV for external use.
4. Graphical Charts
The Analytics Tab also renders high-quality graphs for visual analysis:
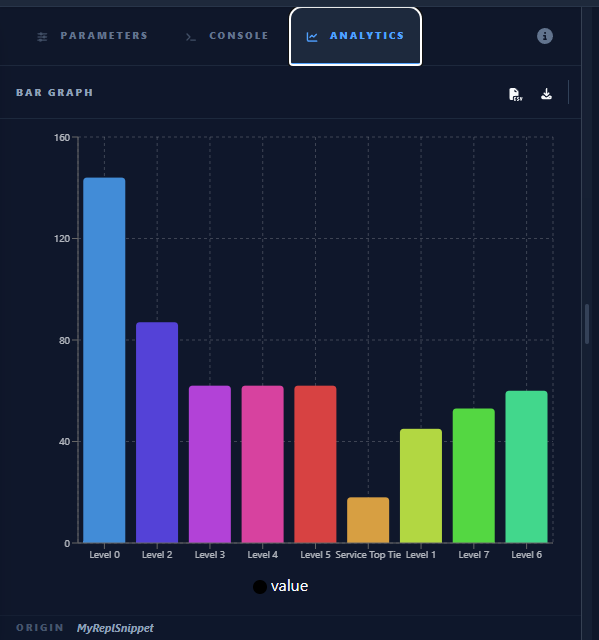
- Supported Types: Pie Charts, Bar Charts, and Line Charts.
- Graph Controls: Each graph features two buttons at the top-right corner:
- Export CSV: Download the raw data used to generate the graph.
- Export SVG: Download a high-resolution vector image of the graph.
Console Tab
The Console tab provides the raw execution log.
- Live Feed: See all
PrintandPrintlnstatements as they happen. - Status Link: Click the Execution Status (✅/❌) button to quickly jump here and see the final success or failure message.
Metadata Tab
Displays non-functional details like the Author, Description, and required Revit Document Type.